This following post utilized data from a private precision teaching clinic in the United States. Each student in this data has a score for accuracy and fluency of math pinpoints at intake and then their score for those skills on a CBM after 40 hours of instruction.
This report includes: Sample visualizations to understand the sample of participants. Data reshaping to convert the dataset into a tidy format. Analysis for three research questions using clustering, regression, and ANCOVA.
###Research Questions and Methods:###
What math skills, when grouped, predict other skills?
What math skills predict outcomes on the CBM after 40 hours of instruction?
How do targeted versus untargeted math skills relate to CBM outcomes?
Before loading the dataset, I cleaned it in a separate script to remove names and replace them with unique ID numbers for student privacy.
In this project, the first step I took was to load all required R packages. For data manipulation (tidyverse), visualizations (ggplot2), clustering analysis (cluster), tidying model outputs (broom), and running regression models (lme4).
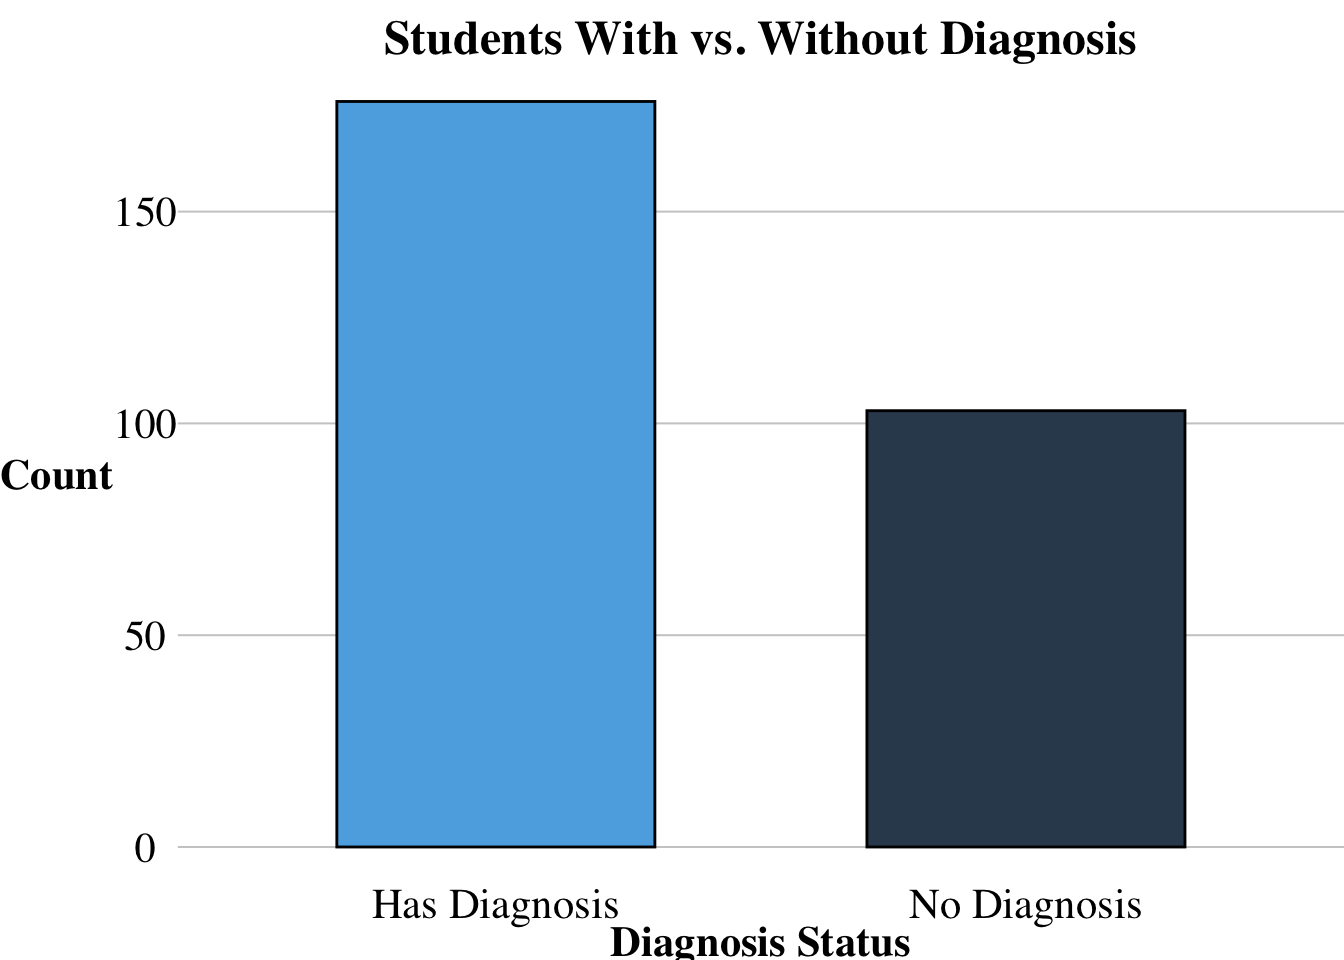
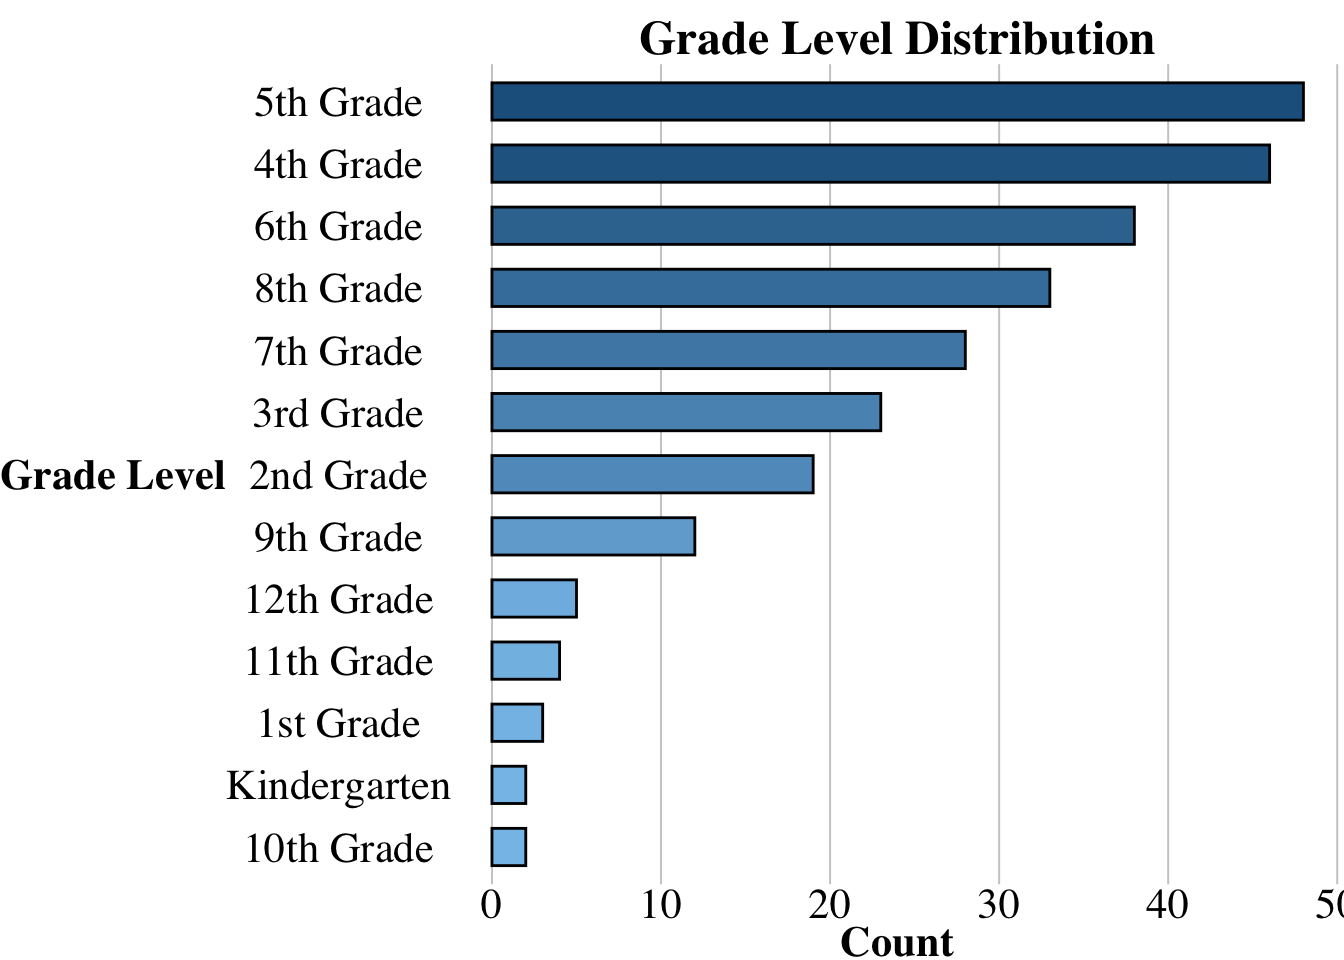
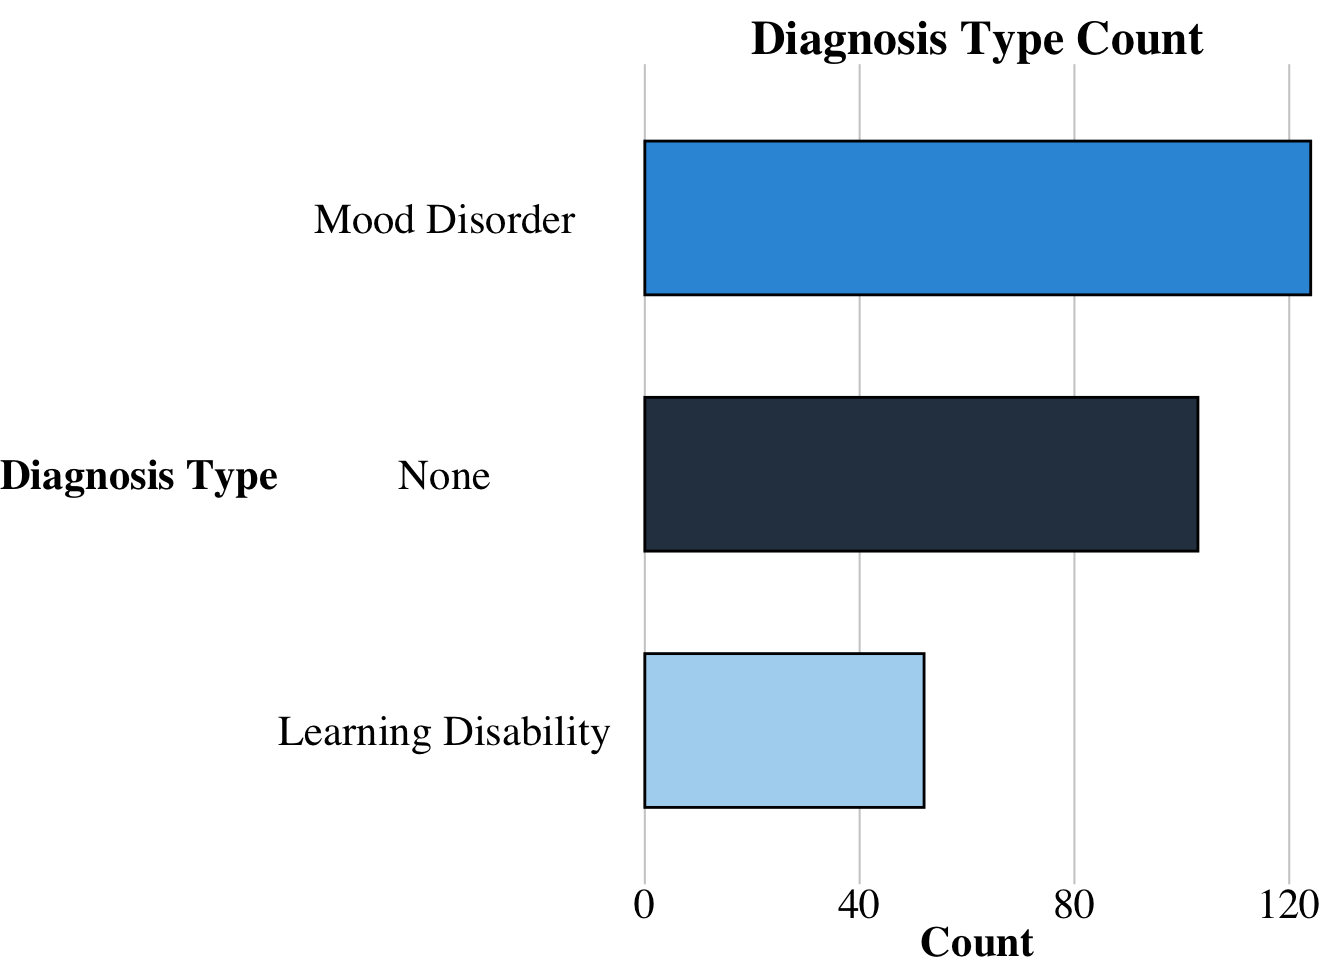
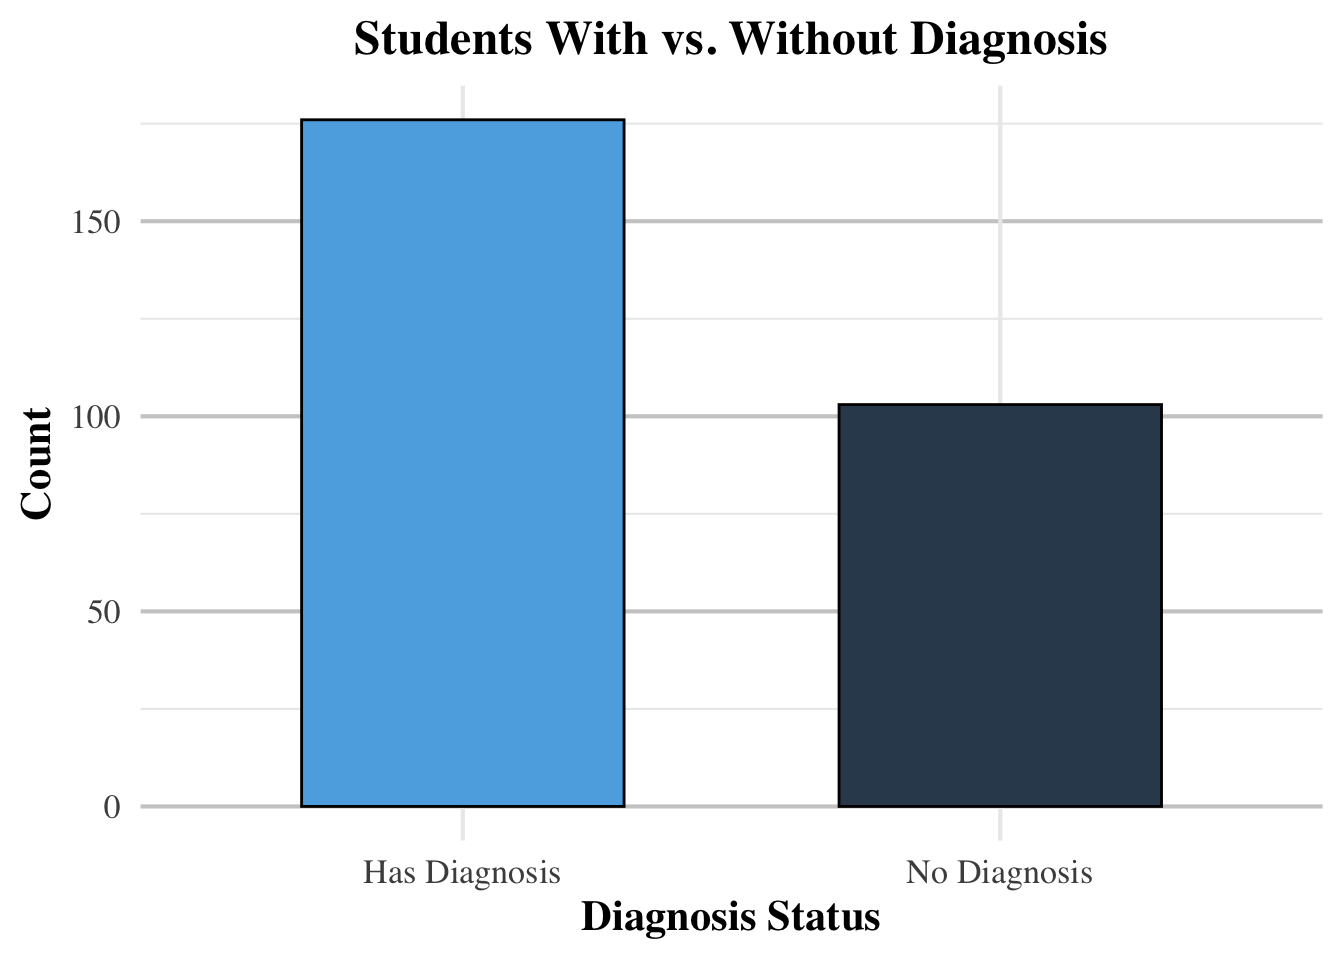
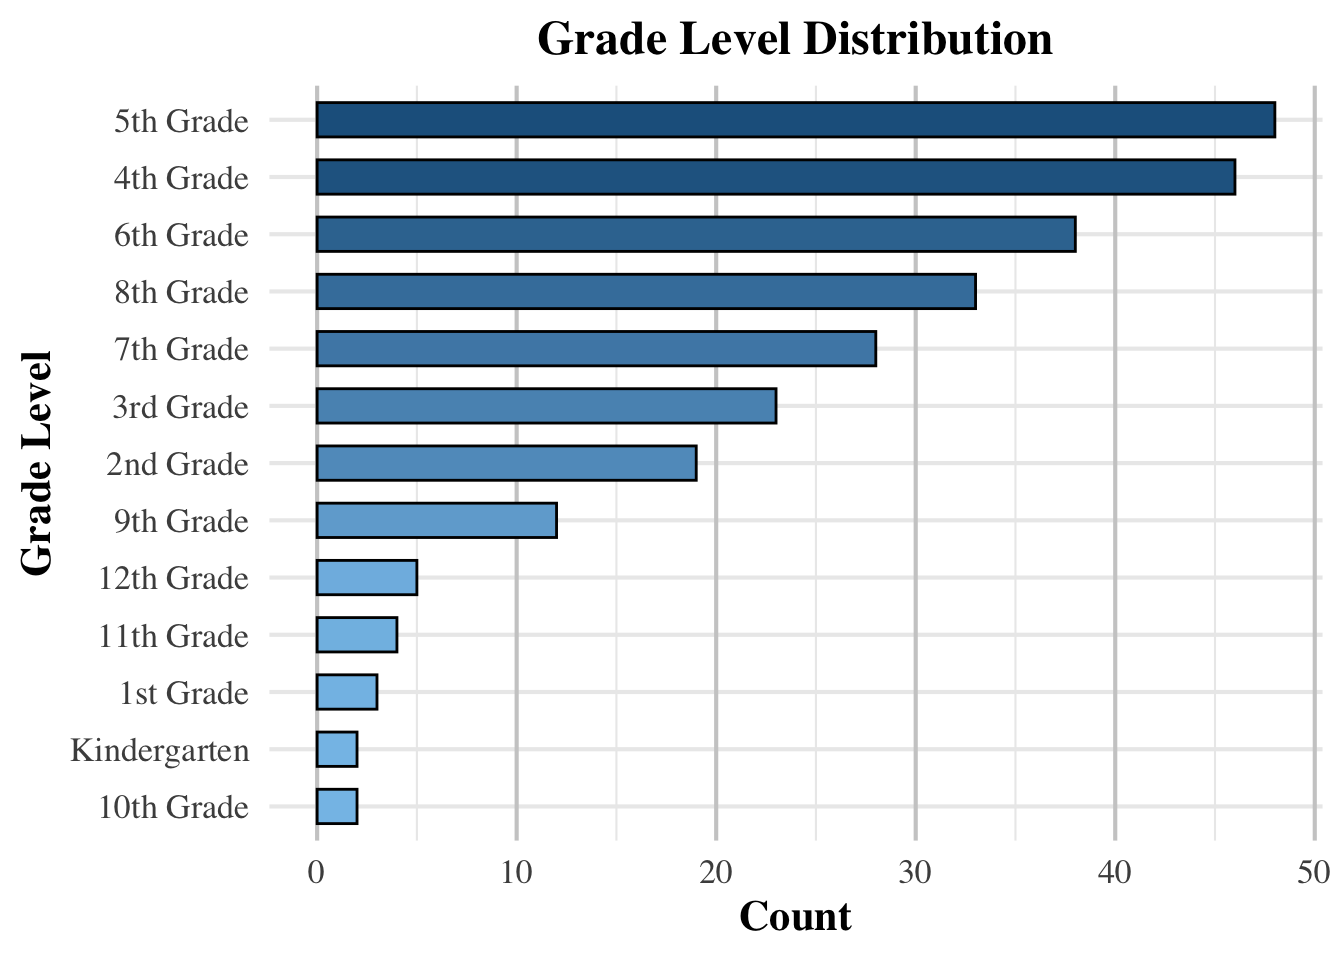
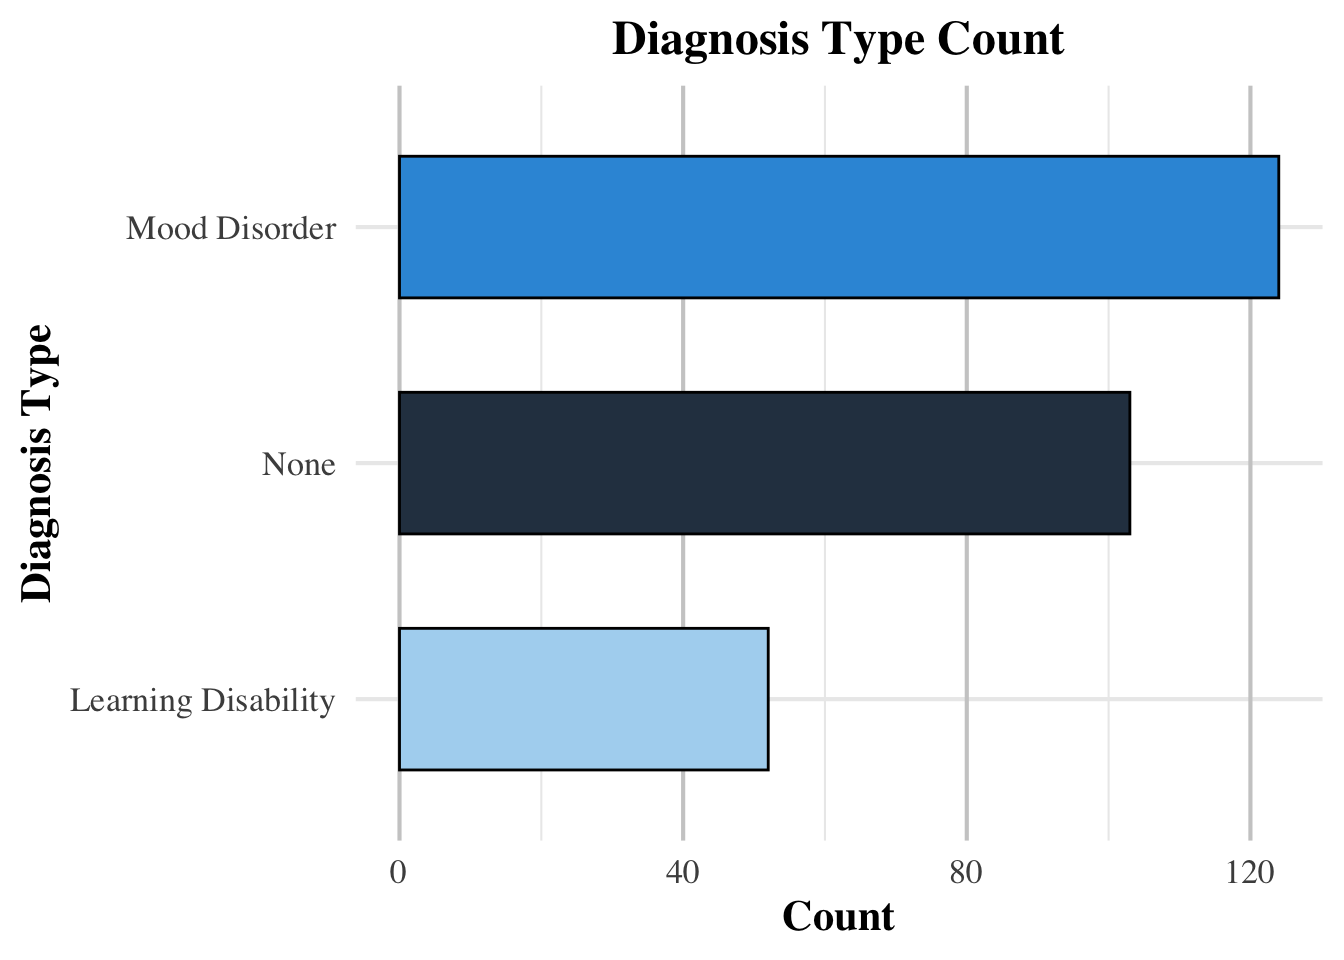
Here are the visualizations of the sample participants.
[edit this now that changes were made]I reshaped the dataset to a “tidy” format, where each row represents: Participant_ID, Grade Level, Diagnosis, Skill, Measure` (Intake Accuracy, Post Fluency, etc.), Score. I converted categorical variables to factors to avoid regression errors. And I removed levels with only one category to prevent contrast errors in regression.
Total rows: 124200 NA values in Score: 47403 Percentage NA: 38.16667 %# A tibble: 6 × 6
Column_1 Column_2 Column_3 Skill Measure Score
<dbl> <chr> <chr> <chr> <chr> <dbl>
1 3 None 2nd Grade Skip Count by 10 Forwards to 1,000 … <NA> 84
2 3 None 2nd Grade Skip Count by 10 Forwards to 1,000 … <NA> 100
3 3 None 2nd Grade Skip Count by 10 Forwards to 1,000 … <NA> 92
4 3 None 2nd Grade Skip Count by 10 Forwards to 1,000 … <NA> 100
5 3 None 2nd Grade Skip Count by 10 Forwards to 1,000 … <NA> 0
6 3 None 2nd Grade Skip Count by 10 Backwards From 1,0… <NA> NA////// ## Answer Research Questions
to address this I used a Correlation analysis to identify skills that improve together. Then I did Association rule mining to find patterns where mastering one skill predicts mastery of another. I then created the following visualizations: a correlation heatmap and association rule graph.